Checking shipment state and location
Initial data are available in the dashboard within approximately 6 minutes after sensor activation. This is the first transaction that shows shipment state right after sensor start. All the future transactions are collected according to the sensor settings.
To check your shipment status and location, go to the logistics dashboard > Locations, find the shipment in the table and click its name.
In the page that opens, you can see:
The shipment main information;
The shipment route planning and checkpoints.
A list of sensors linked to this shipment with quick data on each of them;
An interactive map with the shipment route;
The list of alerts.
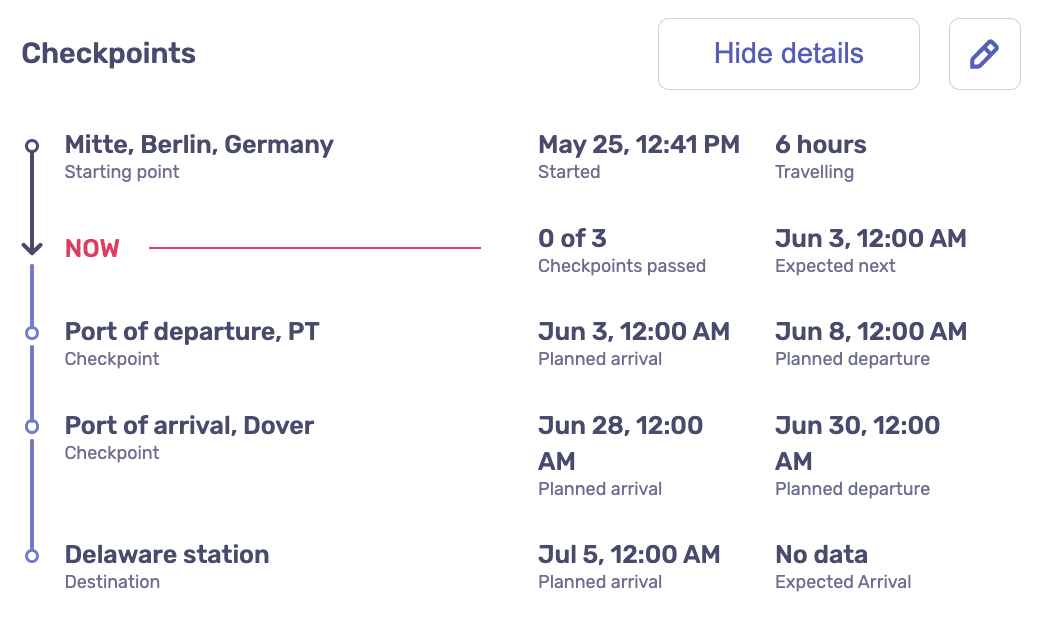
First of all, if you have set up checkpoints for your shipment, you can check how it is moving along its route. Take a look at the Checkpoints section. On the left, you can see the starting point of your shipment, its current checkpoints passing, and final destination. On the right, you can see when the tracking has started, how long the shipment is in transit, the number of checkpoints passed, and ETA for each checkpoint. If you want to view the whole list of checkpoints, click Show more.
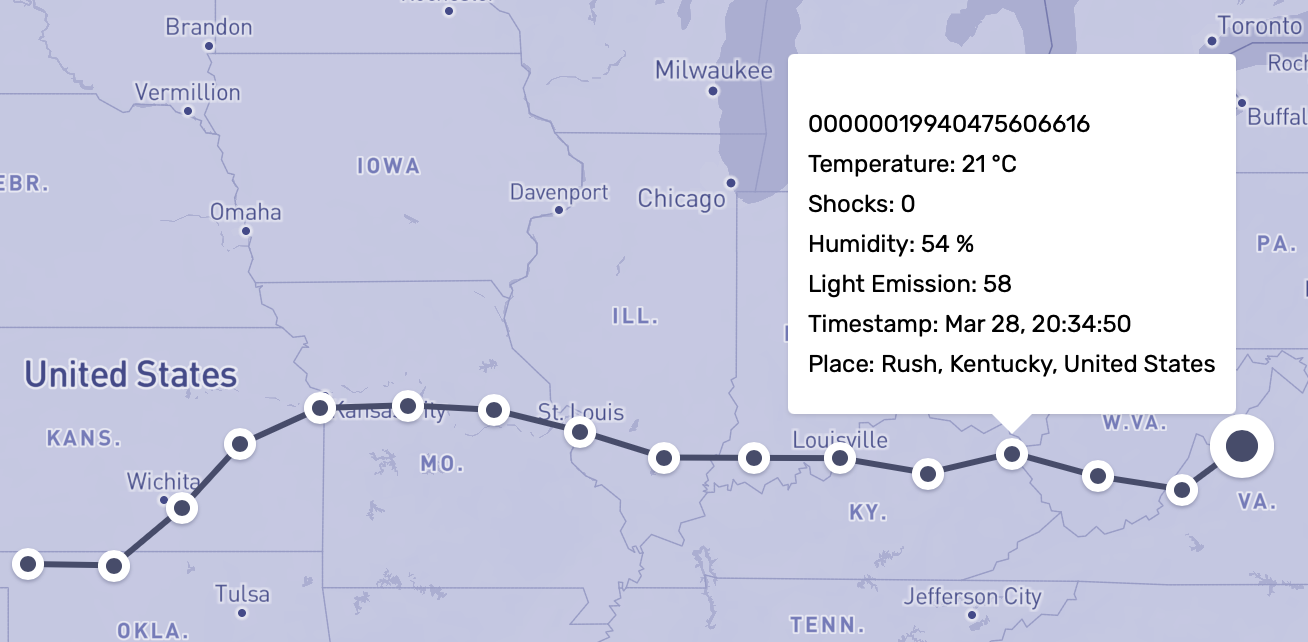
Secondly, you can learn your shipment conditions in a certain location. To do that, click the corresponding transaction point on the interactive map.
Tip
The number of points shown is scalable and depends on the map zoom level. To display all points, set the map zoom to maximum.
To view data from a certain sensor of a shipment, click its number in the table. In the page that opens, you can see an interactive map with the shipment route and the shipment history block.
The shipment history block stores all the transactions sent from the sensor. To identify your shipment state, look at the metrics widgets and graph. Sharp fluctuations from the graph average should draw your attention as they can mean a possible violation of transportation conditions. To view metrics for a certain point, hover over the graph.
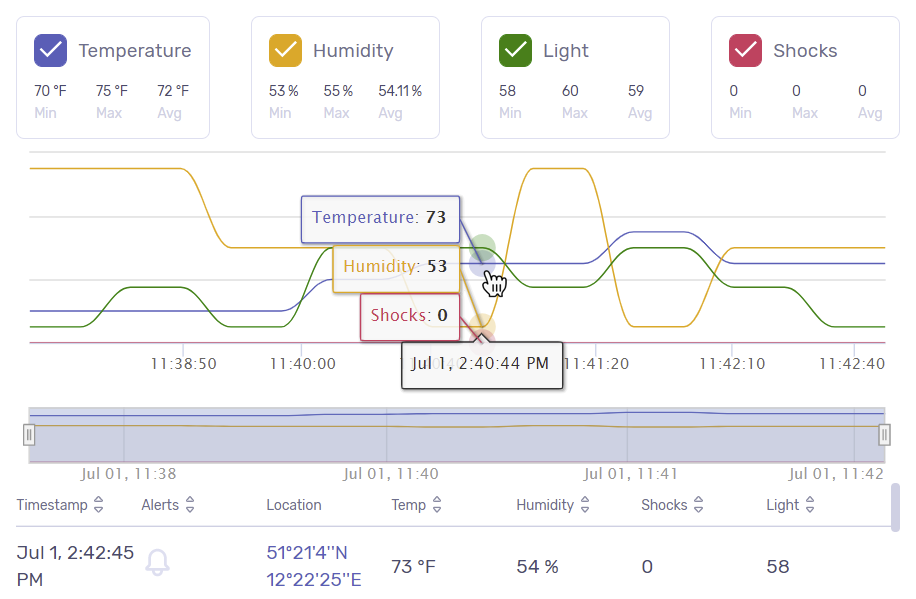
Additionally, you can check transactions one by one using the table. By default, the latest received transactions show at the top of the table. But you can filter the results by any column in a descending or ascending order. To do so, click the column header.
For each transaction, check its precise location, ambient temperature and humidity, light exposure, acceleration, and triggered events.
Another way to monitor your shipments is the shipment lifecycles dashboard. Learn how to read them in the corresponding article.


